Working with Tool Chains
The Tools Diagram panel between the tool list and Tool Configuration panel, provides a visual representation of the data flow in a system (the output from a sensor group, and the input and output of tools). It lets you create and view complex tool chains with drag-and-drop and other mouse operations, letting you quickly and easily implement and maintain applications requiring multiple, interconnected tools.
All data types (if available) and their relationships between tools are displayed:
- Profile data (either directly from a sensor group’s output or from tool output)
- Surface data (either directly from a sensor group’s output or from tool output)
- Measurements (for use as anchors)
- Geometric features
- Tool data (some data outputs are intended to be consumed only by SDK applications and can’t be used as part of a tool chain)
For details on how the Tools Diagram panel displays information, see Understanding the Data Flow in Tool Chains.
For details on how to connect and disconnect, see Connecting Tools and Disconnecting Tools.
The Tools Diagram panel is open by default. The inputs, parameters, and outputs of the tool selected in the Tools Diagram panel are displayed to the right of the Tools Diagram panel.
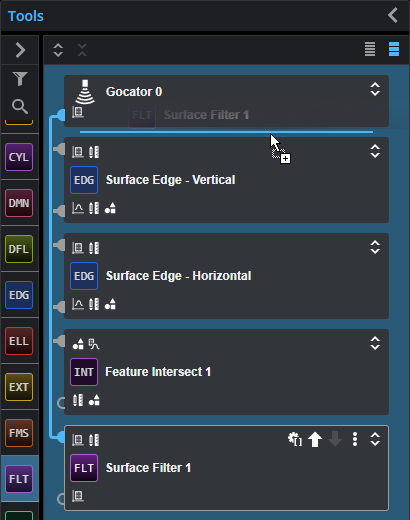
The following shows the main features of the Tools Diagram panel.

Tools Diagram panel showing sensor group, tools, outputs/inputs, and data flow connections.
At the top of a tool, an action menu provides functions to rename, duplicate, and delete the current tool.
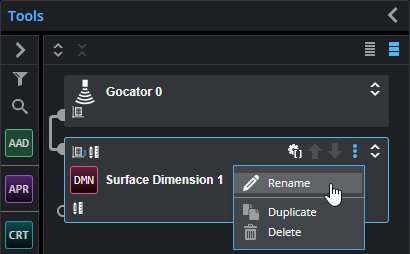
Action menu (collapsed tool)
Changing Tool Display Options
The buttons at the top of the Tools Diagram panel let you control how the panel displays sensor groups, tools, and the data flow (tool chain). Buttons at the top of individual tools let you organize the tools in the list, as well as name, duplicate, and delete them.
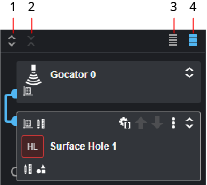
The following describes the toolbar's functions:
- Open All: Expands sensor group and all tools in the Tools Diagram panel, displaying a list of available inputs and enabled outputs for each one.
- Close All: Collapses all items in the Tools Diagram panel.
-
Compact View: Hides the list of small input and output icons that indicate the types of the inputs and outputs the sensor or a tool has.
-
Standard View: Shows small icons that indicate the types of the inputs and outputs the sensor group or a tool has. For a list of inputs and outputs, see Data Types.
Reordering Tools
You can reorder tools in the Tools Diagram to organize them more logically or to better represent the data flow. For example, you could group tools that output geometric features with the tools that use them, or group tools you use as anchors with the tools that use those anchors.
Note that the order of tools in the Tools Diagram panel does not affect the flow. Also, note that tools are added after the currently selected tool in the tool list.
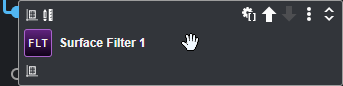
You can reorder tools you have added by dragging and dropping them to the position you want in the list of tools, or by using the up and down arrows.
Moving the Surface Filter tool to the top of the tool chain.
If you hover the mouse pointer over a tool in the Tools Diagram panel, you can use the up / down buttons next to the action menu to move the tool up or down in the panel.
Data Types
GoPxL represents the data types of inputs and outputs in the Tools Diagram panel with an icon.
|
Icon |
Description |
|
|
Surface data |
|
|
Profile data |
|
|
Measurement |
|
|
Geometric feature |
|
|
Tool data |


Understanding the Data Flow in Tool Chains
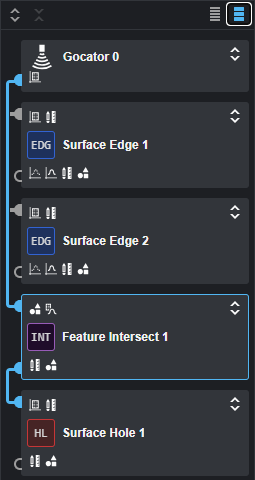
The rectangular elements displayed in the Tools Diagram represent a sensor group at the top and any tools you have added below that. Sensor groups display output connection nodes, whereas tools display both input and output connection nodes.
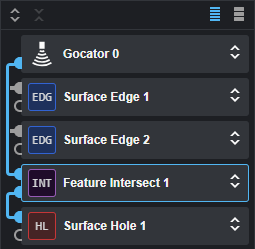
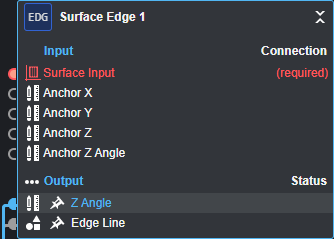
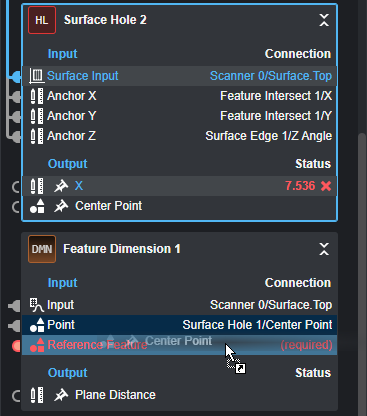
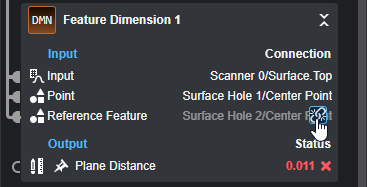
The appearance of nodes changes depending on whether they are connected and whether they are selected. Connections that are used are filled. Connections that are not used are empty. When a sensor or tool is expanded, you can see which specific inputs or outputs are used and part of the tool chain. For example, in the expanded Surface Hole tool below, we can see that the first three inputs (Surface Input and the X and Y anchors, receiving their input from the sensor group at the top and from Feature Intersect, respectively) and the Center output are involved in the chain of sensor group and tools.

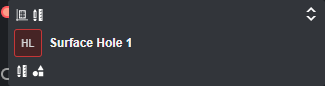
When a tool is collapsed, however, you only know that at least one input or output is used (or none at all). For example, looking at the collapsed Feature Dimension tool at the bottom, we know that at least one input (the connection node at the top) is used, and that none of the tool’s outputs are used. Also, we know that inputs and outputs of the three collapsed tools at the top are used, but not exactly which ones.
In both cases (collapsed or not), the data flow of the selected item is indicated by blue connection lines. For more information, see below.
By default, sensors and tools are collapsed, but you can expand them individually by clicking the expand / collapse button at the top right of a tool to display the complete list of available inputs and outputs. Note that for an output to be listed in the Outputs section, it must be enabled in the tool’s configuration: in the tool’s Output list, only enabled outputs are listed.

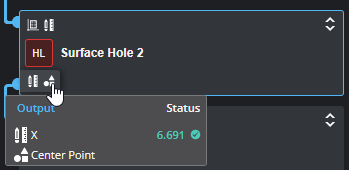
When a tool is collapsed, you can “peek” the available inputs or the enabled outputs by clicking one of the horizontal lists of small icons (Standard view only). Clicking an item selects it for display in the Displayed Outputs panel below the data viewer.
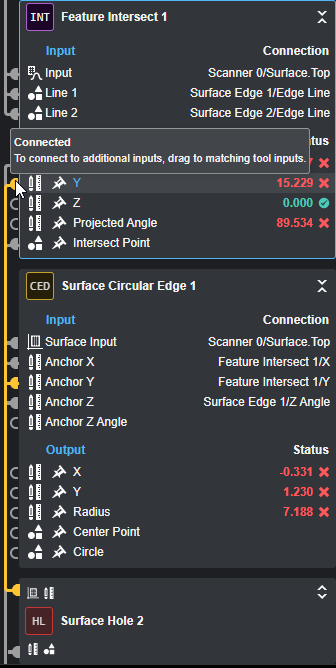
If you hover the mouse pointer over a blue connected node, a part of the blue connection line is highlighted to indicate what it is connected to. In the image below, you can see that by hovering over an output (the Y measurement of the Feature Intersect tool at the top) is used as an input (the Y anchor) of the Surface Circular Edge at the bottom.
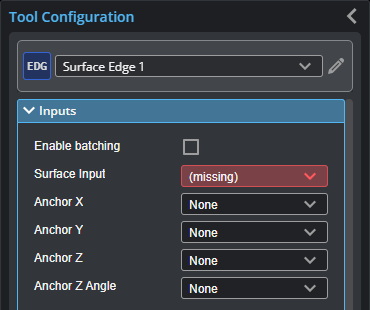
If a tool's input is missing, that input is displayed in red in the Tools Diagram panel to show that you must connect it to something. You can also consult the Problems tab in the System Messages panel at the bottom of the interface to see which tools are missing inputs.
Collapsed tool with a missing input
Expanded tool with a missing input
In the Tool Configuration panel, a tool whose input is no longer available (for example, you have removed the preceding tool in the tool chain ) displays "(missing)" in the input parameter.
Connecting Tools
The Tools Diagram panel lets you quickly connect tools using drag-and-drop operations.
In the following, we connect a geometric feature output from one tool to the input of another tool. However, the same procedure applies when connecting other kinds of outputs to inputs, such as connecting a measurement from one tool to one of the anchors available in another tool, or when connecting Surface output (such as the output from the Surface Filter tool) to the input of another tool (which is initially set to the direct output of a sensor).
To connect a tool’s output to another tool’s input:
| 1. | Make sure you have added at least two tools and that you have configured the tools higher in the tool chain. |
The output you want to connect must be enabled in the first tool.
For information on adding tools, see Understanding the Data Flow in Tool Chains.
| 2. | Locate the tool whose output you want to use (the “source” tool). |
| 3. | Do one of the following: |
From an expanded tool
| a. | Click and hold the output you want to connect to the other tool’s input and drag it to the input. |
Here, we are dragging the Center Point output. Tools with compatible inputs (here, the Feature Dimension tool), are highlighted with a dark color.

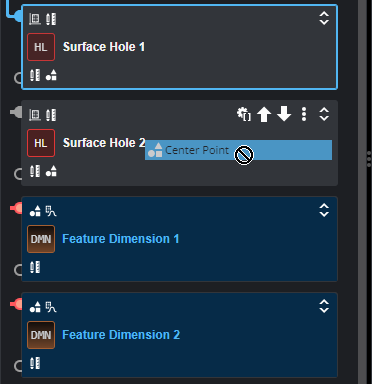
From a collapsed tool
| a. | Click the small output types at the bottom of the tool to expand the list of |

A list of enabled outputs is displayed in a pop-up list.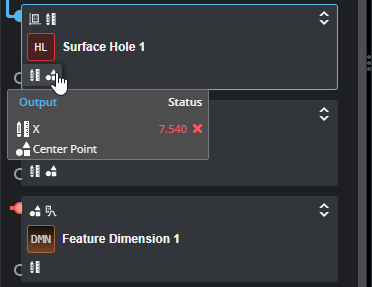
| b. | In the pop-up list, click and hold the output you want to connect to the other tool’s input and drag it to the input. |
A list of enabled outputs is displayed in a pop-up list.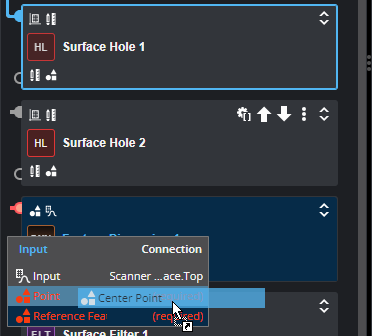
Tools with compatible inputs are highlighted with a dark color. Here, the two Feature Dimension tools have compatible inputs.
| 4. | Drop the output on the desired input. |
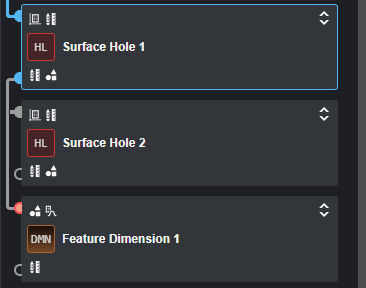
A new connection appears between the first tool’s output and the second tool’s input (below, between the Surface Hole tool’s Center Point output and the Point input in the Feature Dimension tool).
You can also drag-and-drop outputs when one or both tool blocks is expanded.
Disconnecting Tools
You can quickly disconnect an input in the Tools Diagram panel, but only if the tool containing the input is expanded.
To disconnect an input in a tool:
| 1. | If the tool isn’t expanded, click the Expand button at the top of the tool. |
| 2. | In the expanded tool, move the mouse pointer over the input you want to disconnect and move it to the right until the pointer is over the Disconnect icon. |
| 3. | Click the Disconnect icon. |
The input is disconnected from the other tool’s output.